Conference Data Visualisation Web Application

Overview

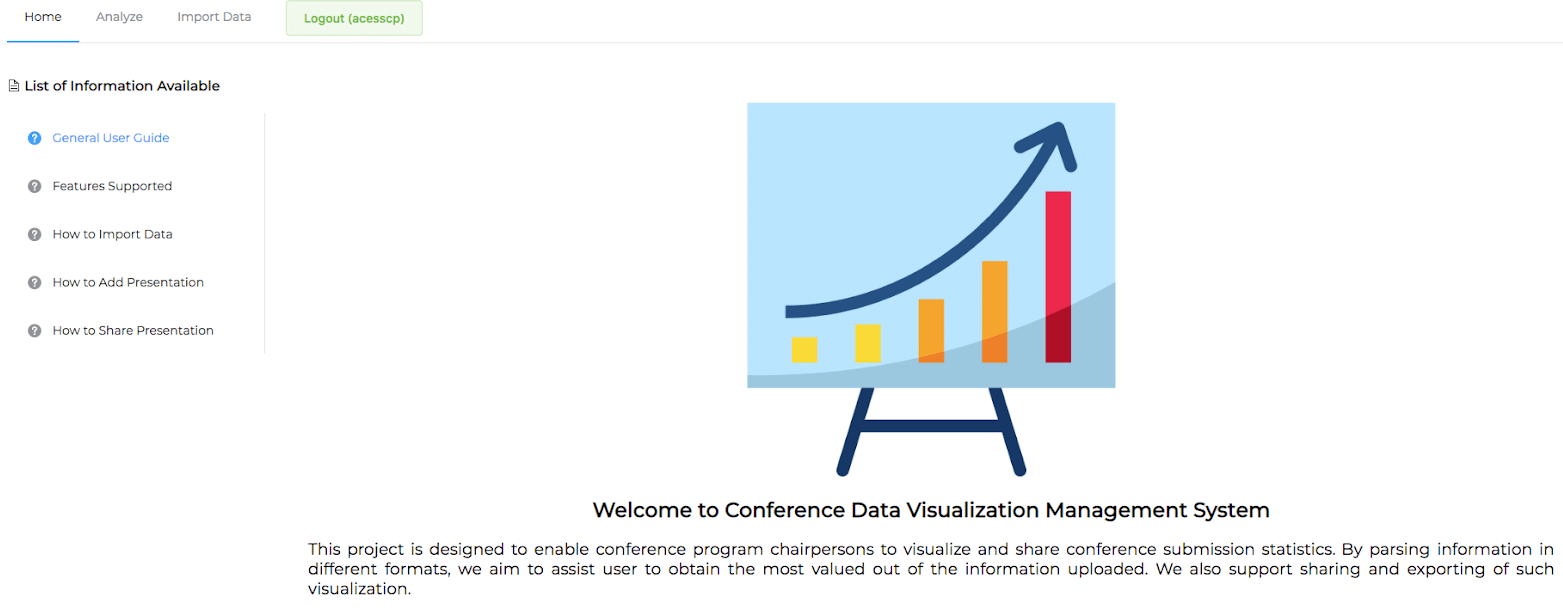
Conference visualisation tool home page
Web app allowing users to convert excel conference data into proper visualisation for analysis.

Every year, there are multiple research conference and paper submissions. With such a vast amount of data, it is extremely tedious for the conference chairperson to have an overview understanding of the conference papers’ trends and main topics.

Hence, with the help of our web application, conference chairperson can simply upload the conference data summary and different visualisations will be shown to him for easy analysis of conference data. He will also have a better understanding of how each conference is performing.

As shown on the right, by uploading an excel file with pre-defined set of conference data, we will map each columns in the excel to an existing field in our database. 

Users can select or deselect certain mappings based on their needs. Upon clicking on the upload button, the data will be ingested automatically into the database for visualisation purposes.
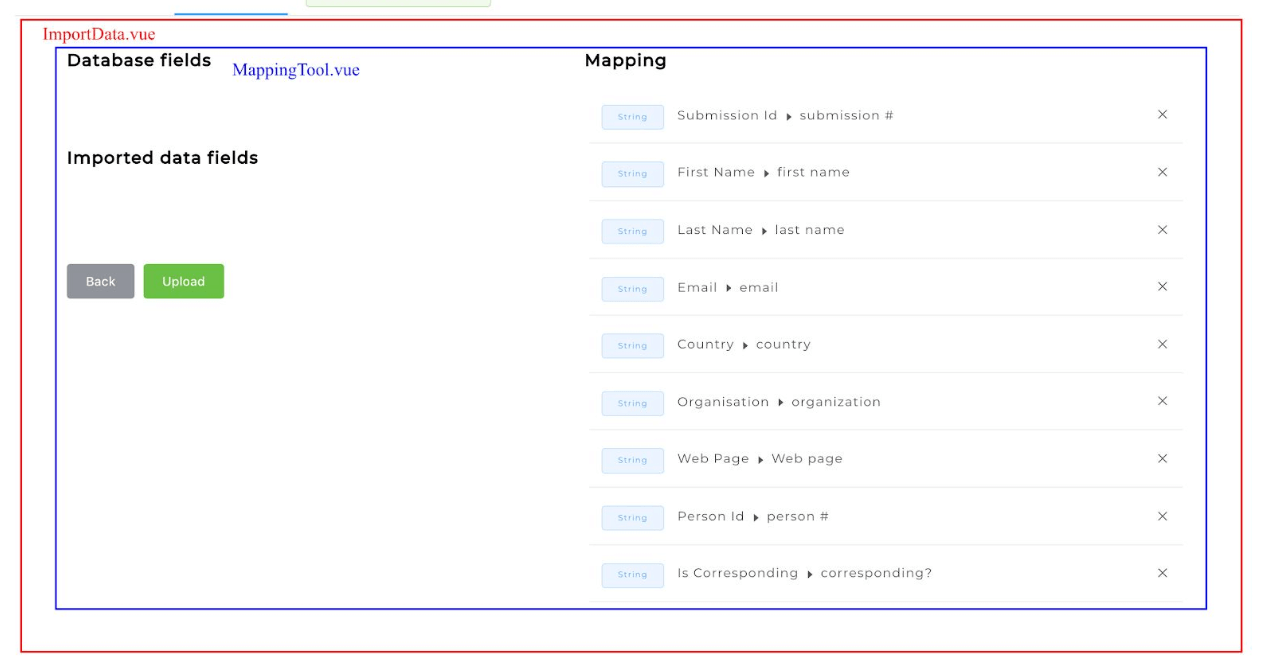
conference visualisation data upload
Sample view of how conference chairperson can upload the excel data.

Core data visualisation features built-in

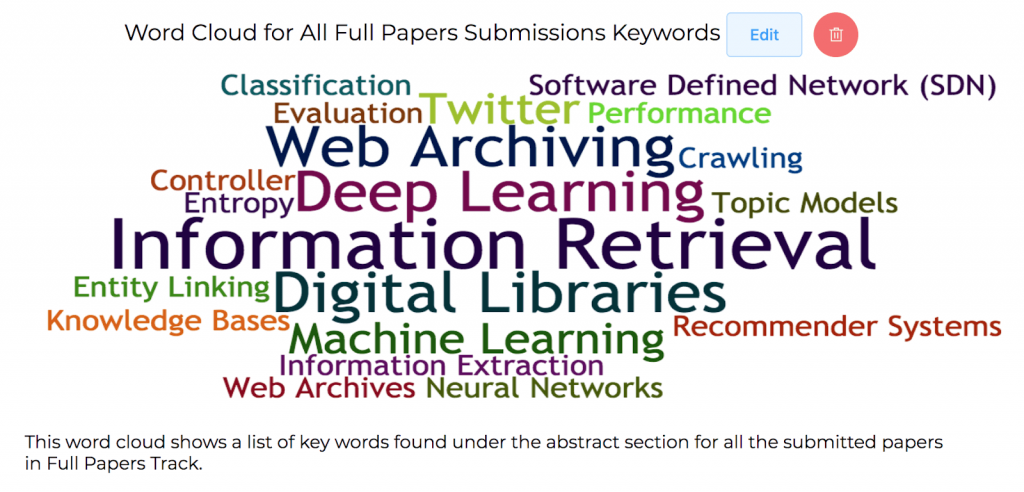
word cloud visualisation
Users can look at the word cloud generated to do analysis of data uploaded.
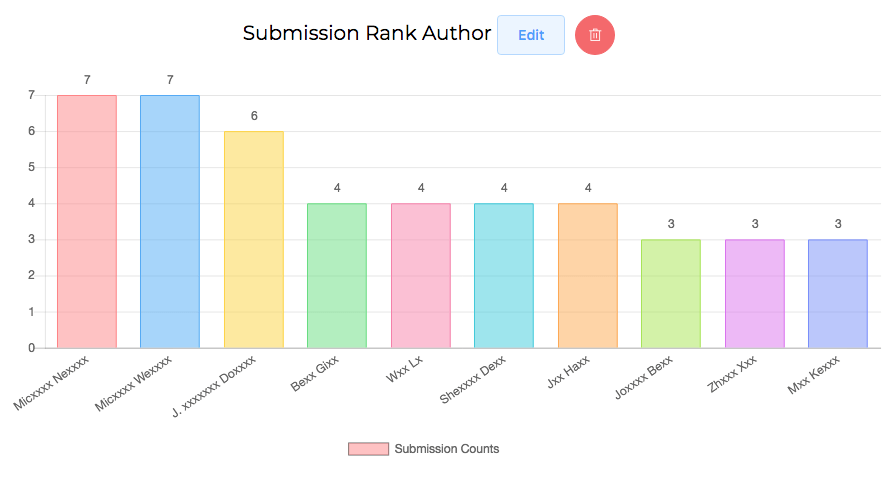
colorful bar chart visualisation
Users can look at the distinct colorful bar chart to do analysis of data uploaded.
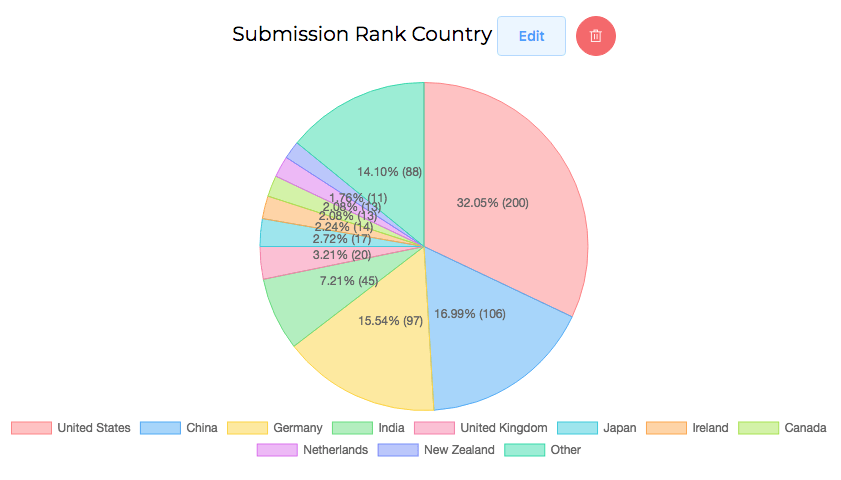
colorful pie chart visualisation
Users can look at the colorful piechart to do analysis of the data uploaded.

Web application design overview

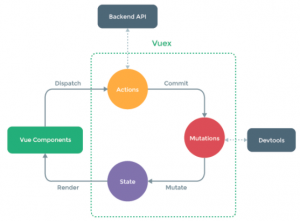
conference visualisation frontend framework overview
Frontend framework overview.

The frontend framework is built using Vue.js, Vue Router and Vuex. This framework is chosen to make use of existing visualisation libraries. Using the Model-View-Controller (MVC) framework, the figure above shows how each frontend component interact with each other and the backend to generate the necessary visualisations shown.

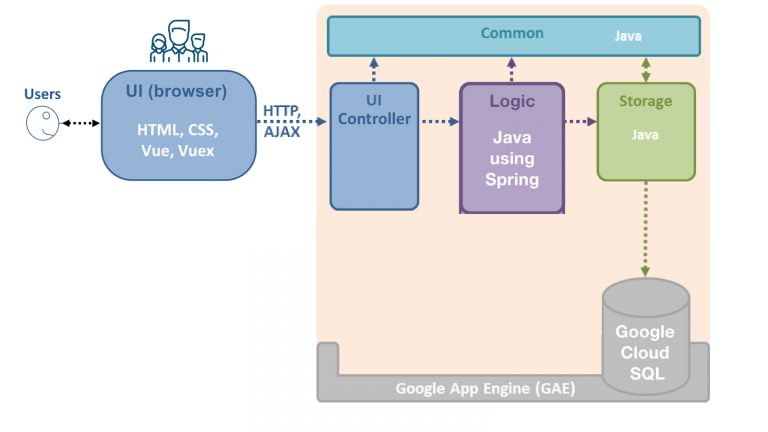
 The backend framework is built using Google App Engine, Spring REST API and Google Cloud SQL (MySQL 5.6). This framework is chosen as Google has many out of the box APIs to be used without the need to build care about the low level abstractions.

conference visualisation backend framework overview
Backend framework overview.
conference visualisation overall framework overview
Overview of the overall design framework and how each component interacts with each other.

Code level abstraction

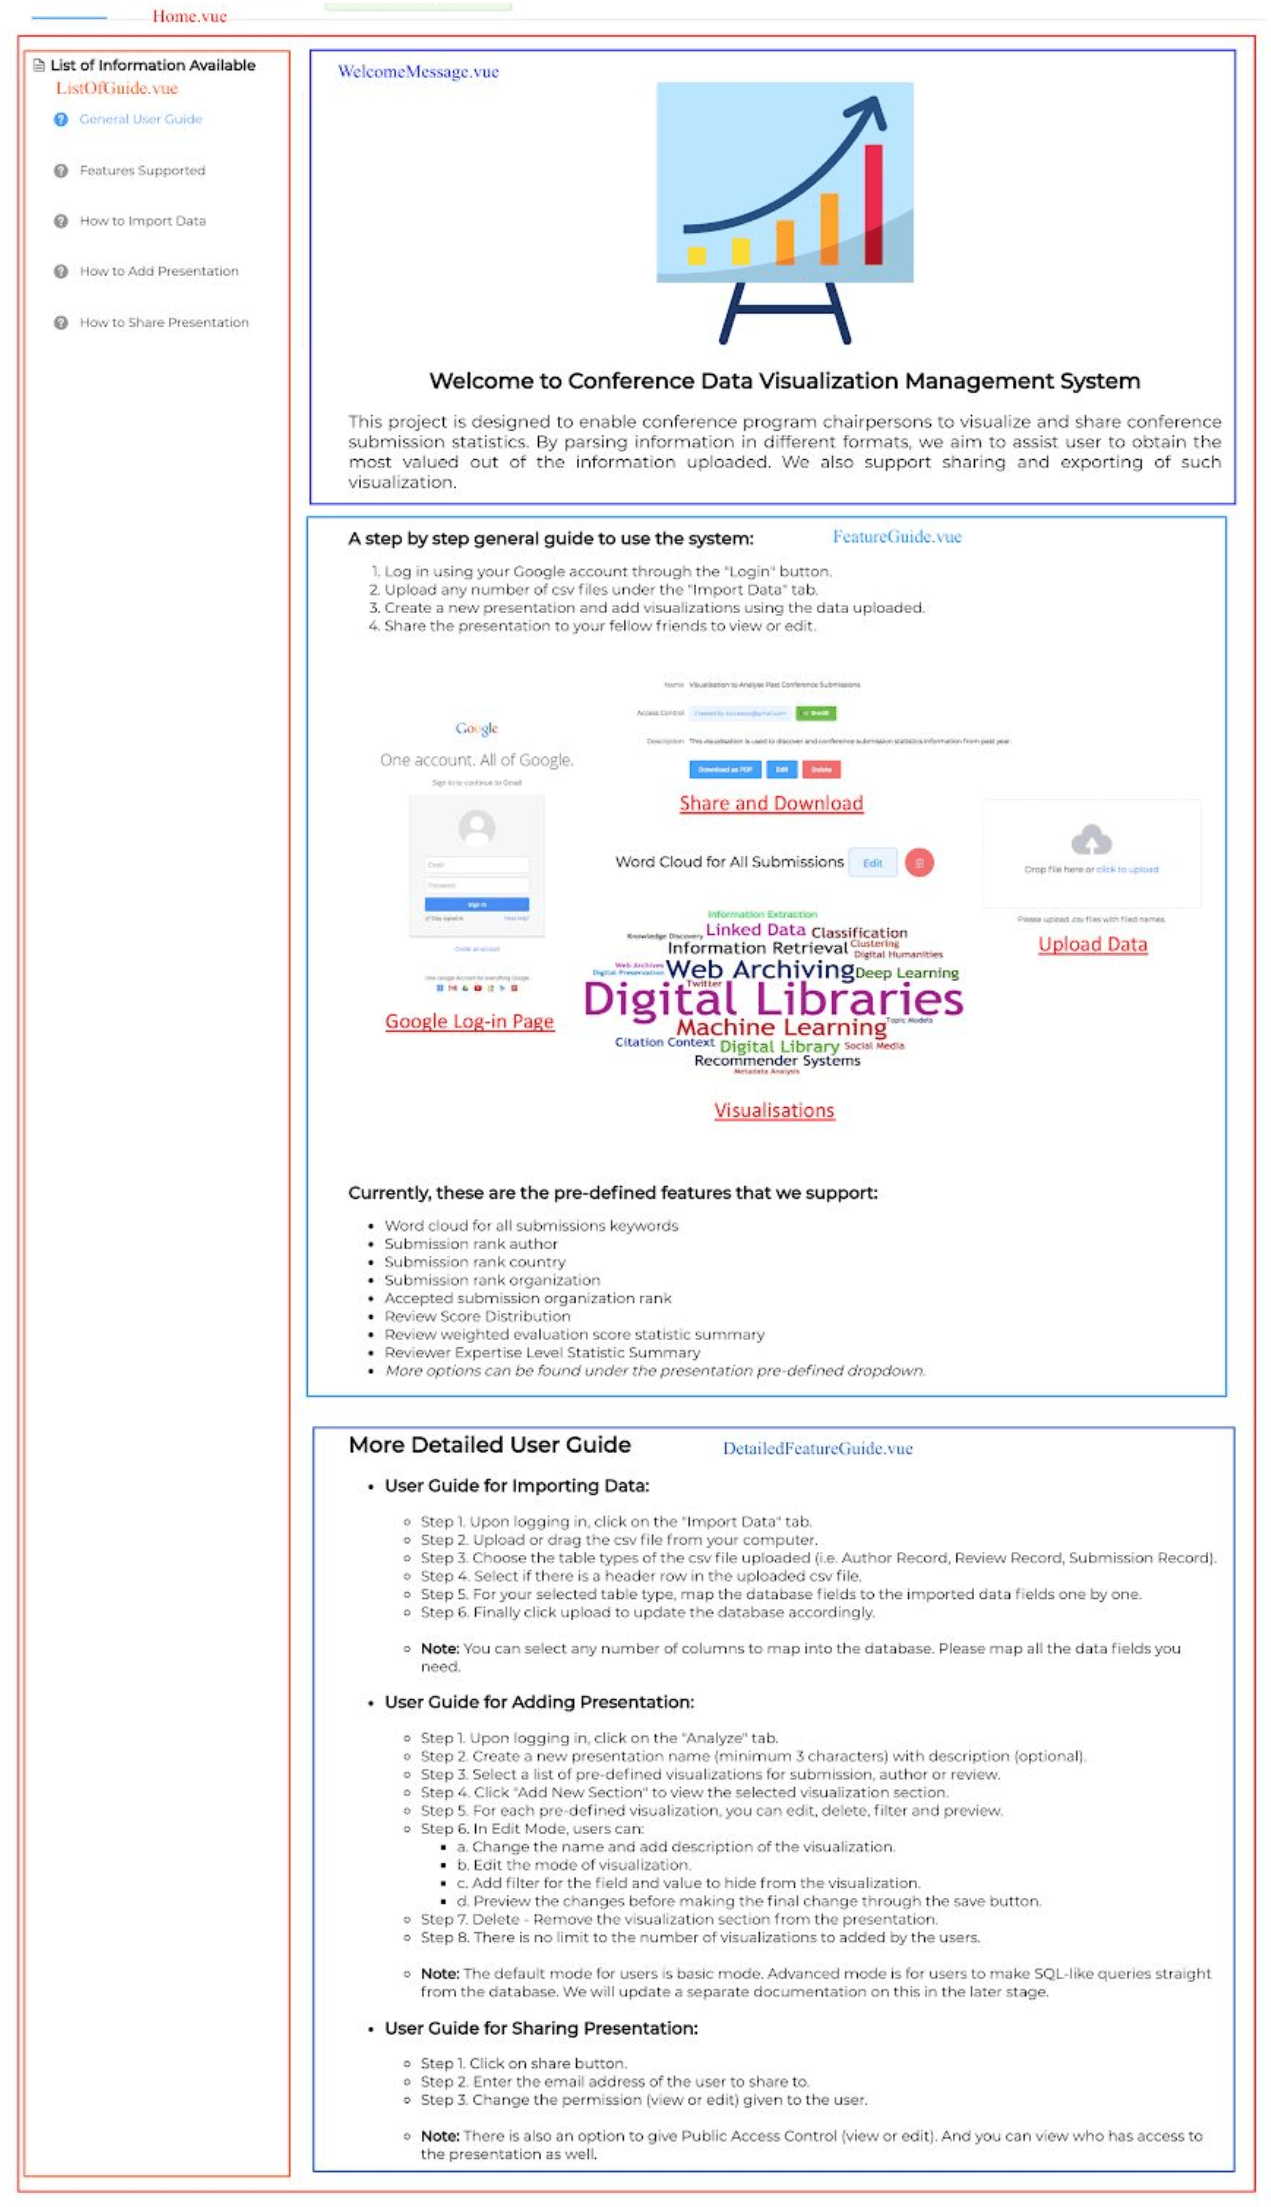
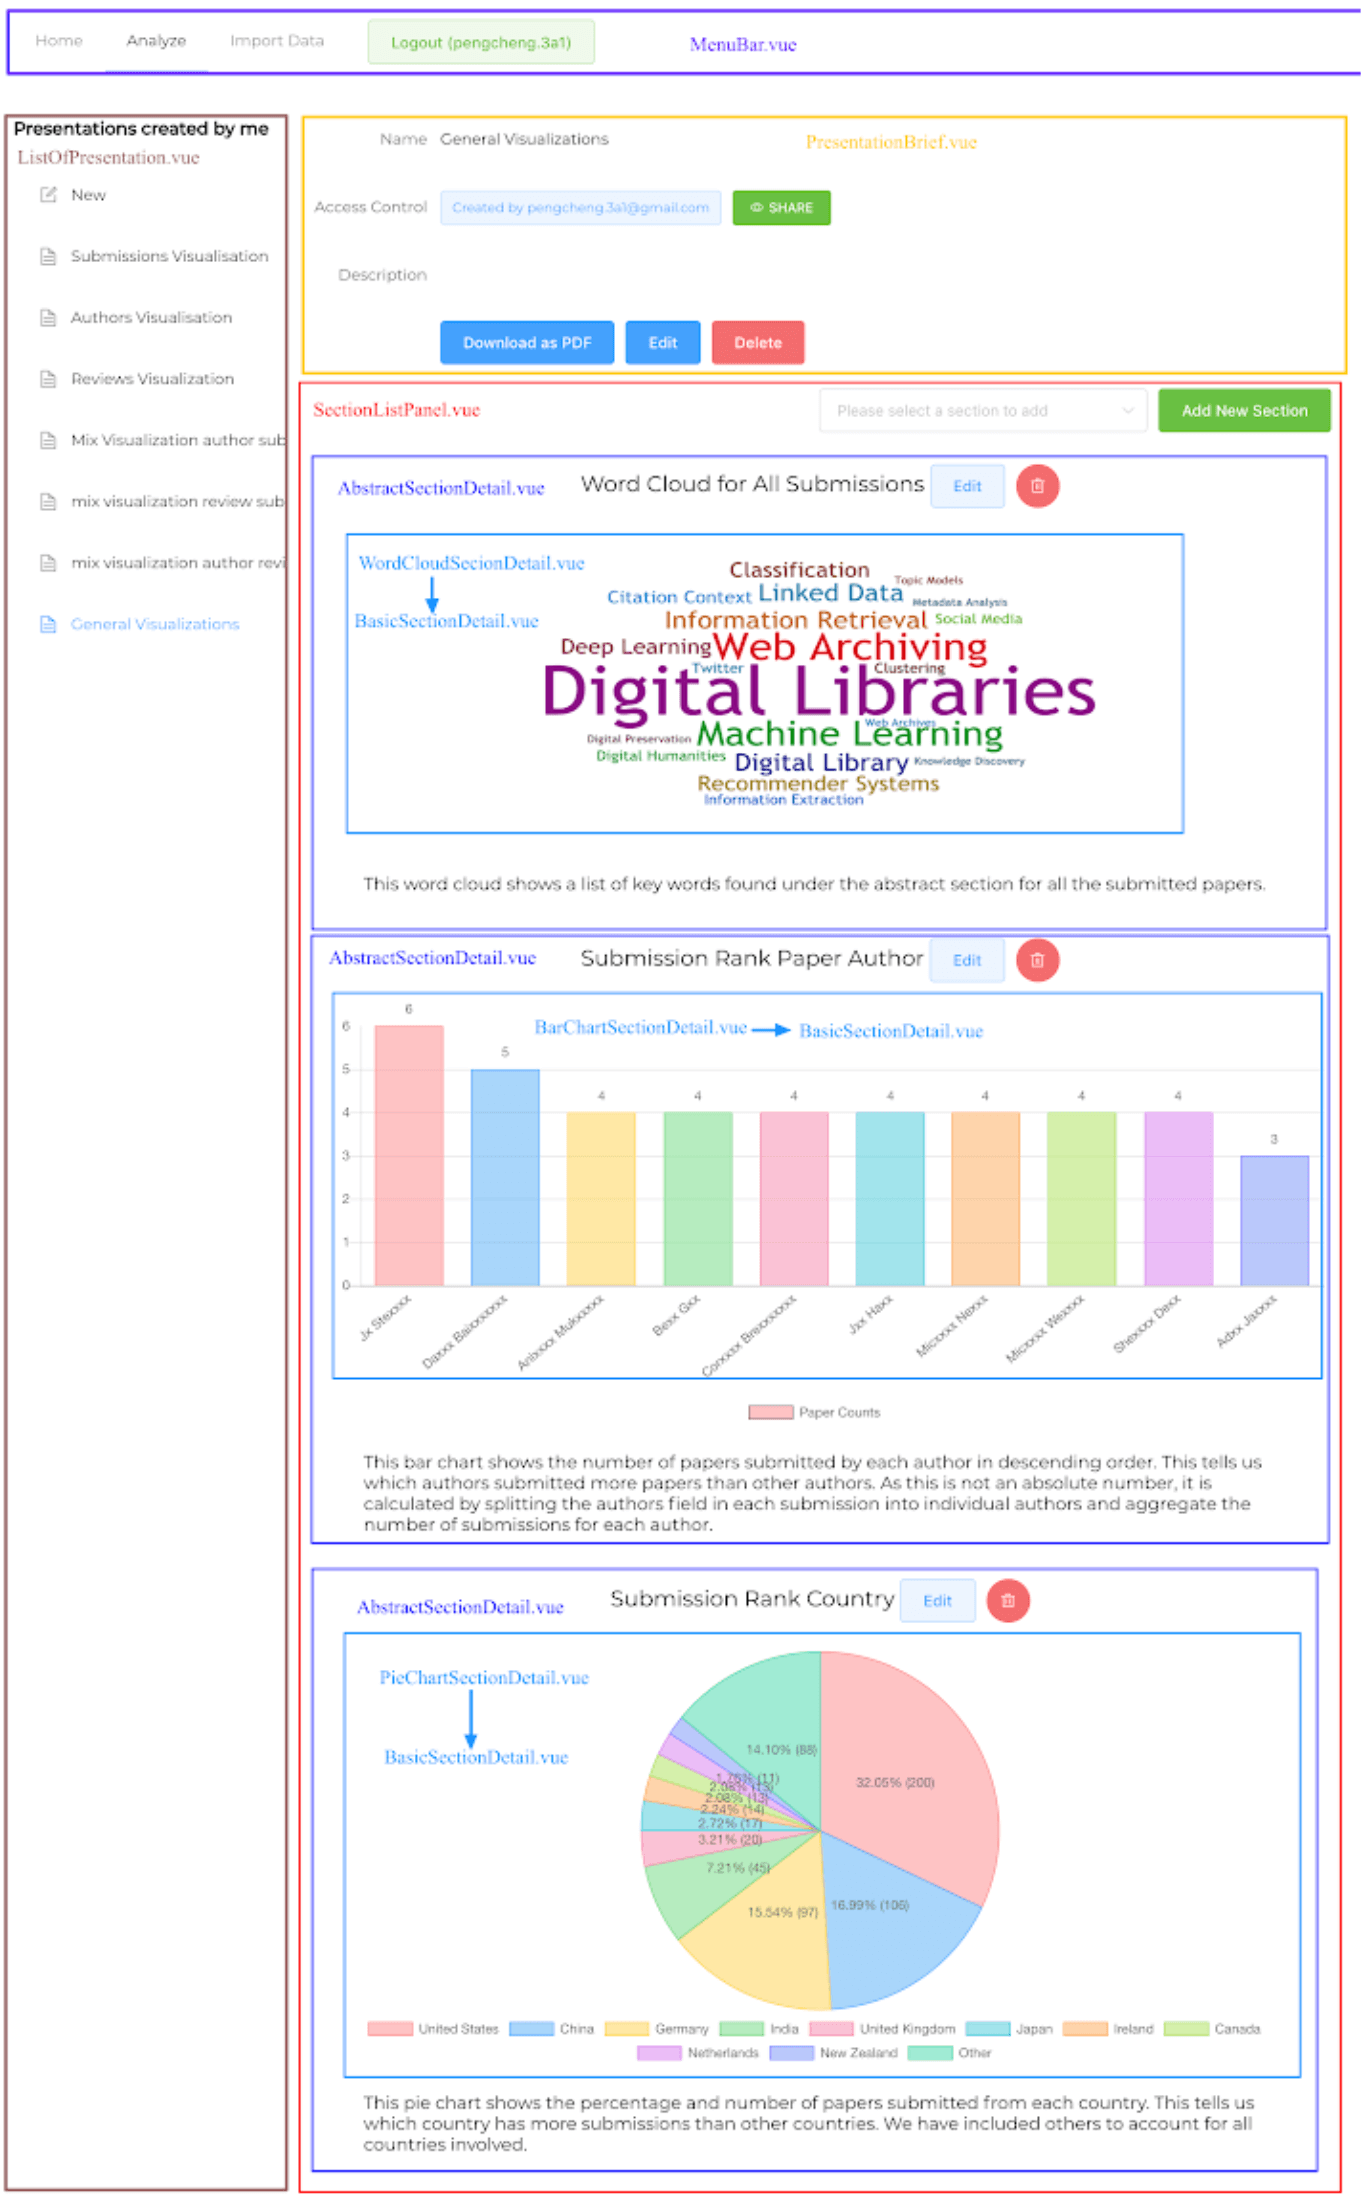
As shown below, each component on the web application is segregated into different files so that they can be reused easily.

conference visualisation homepage breakdown
Breakdown of the web application home page into multiple components.
conference visualisation app features breakdown.png
Breakdown of the web application visualisation features page into multiple components.

Leave a Comment

Your email address will not be published. Required fields are marked *